
AI Audit: Predicting Phoenix HVAC Revenue Patterns Using Late 2026 Seasonality Data

Phoenix-metro HVAC operators can stop guessing at busy-season staffing and inventory. This report lays out a practical AI seasonality model using cooling-degree-day signals, dispatcher telemetry, and membership data — plus a 90-day rollout plan and ROI math.

Phoenix HVAC demand is not “seasonal” in the generic sense — it is a revenue wave driven by heat load, equipment failure rates, and utility behavior. In practice, the best leading indicator for that wave is cooling degree days (CDD): a daily/weekly measure of how far outdoor temperatures sit above a comfort baseline.
The National Weather Service publishes a daily Phoenix climate summary that includes a cooling degree days table (e.g., “COOLING … TODAY / MONTH TO DATE / SINCE …”). (NWS Phoenix Daily Climate Report (CDD table)) Your goal is to treat that signal as the backbone of a forecasting model that tells you, weeks in advance, whether you should staff up, stock up, or slow down.
This report is an “AI audit” for a Phoenix-metro HVAC operator doing $1M–$15M in revenue: it lays out a practical seasonality model, a minimal tool stack, and a 90-day rollout plan. It also flags a 2026 local constraint: APS discontinued its Solutions for Business New Construction program and HVAC rebates under the Existing Facilities program as of January 1, 2026 (citing Arizona Corporation Commission Decision No. 81584). (APS Solutions for Business (rebate discontinuation notice)) That change shifts more of the ROI burden onto operational efficiency rather than utility-funded capex offsets.
Executive Summary (What to Do This Week)
Pick one forecast target: weekly booked revenue (or weekly booked calls if you do not have clean revenue attribution yet).
Use CDD as your baseline driver: create a simple model that predicts weekly demand from CDD + day-of-week + marketing spend + membership base.
Add “operations telemetry” next: callback rate, parts wait time, tech utilization, and first-time-fix rate — these explain margin compression even when revenue is up.
Run one staffing decision off the model: weekend on-call coverage, dispatch staffing, or pre-scheduled maintenance capacity.
Why Phoenix Seasonality Forecasting Is an AI Problem (Not a Spreadsheet Problem)
Phoenix has two compounding drivers that make naive forecasting fail:
Heat load is nonlinear: failure rates and emergency calls accelerate above certain temperature bands. A “hot week” is not 10% busier than a “warm week” — it can be 40–80% busier depending on system mix and housing stock.
Operational constraints create margin cliffs: as call volume rises, your schedule density increases, first-time-fix drops (parts + diagnosis), and overtime rises. Revenue goes up while margin goes down.
AI is useful here because it can combine many weak signals into a single forecast and update continuously. You do not need a PhD model — you need repeatable inputs, a forecast that is directionally correct, and a weekly operating rhythm built around it.
Data You Need (Minimum Viable Forecast)
1) Weather driver: Cooling Degree Days (CDD)
Start with CDD. The NWS Phoenix climate report includes a “COOLING” line with values for today and cumulative periods, which you can use to sanity-check any automated weather feed you ingest. (NWS Phoenix Daily Climate Report)
Implementation note: you do not need to collect this manually. Use any reliable weather API for daily mean temperature and compute CDD, then periodically cross-check against the NWS table so you don’t drift.
2) Business driver: booked calls, booked revenue, and membership base
For most owner-operators, booked calls is the cleanest leading indicator. If you have reliable job-level revenue and margins, use booked revenue. Add “active memberships” (maintenance plan customers) because it dampens volatility: membership creates predictable shoulder-season work and improves schedule fill.
3) Ops driver: utilization, first-time-fix, and callback rate
These three metrics are where margin is won or lost during Phoenix peak season. Your AI forecast should not stop at “volume” — it should explain why you are losing money in your busiest weeks (usually overtime + callbacks + parts delays).
A Simple ROI Model (Staffing + Inventory + Dispatch)
Forecasting does not create value on its own. Value comes from decisions you can make earlier than competitors:
Staffing: set on-call coverage and dispatch staffing 2–3 weeks earlier, reducing overtime and missed calls.
Inventory: pre-buy common failure parts before heat spikes (capacitors, contactors, condenser fan motors) so first-time-fix stays high.
Marketing pacing: throttle demand gen when you are already capacity constrained (you do not want to buy unserviceable leads).
Here is a conservative model you can run without perfect data:
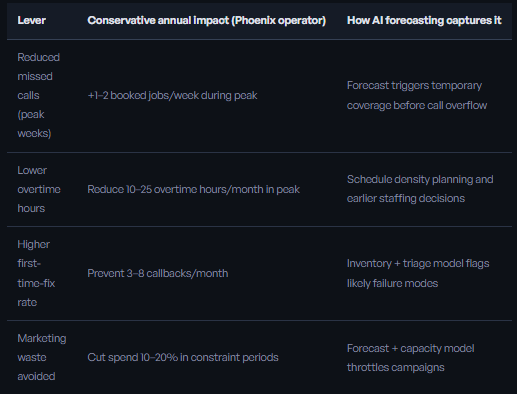
Even if you only capture one of these levers, you can justify a small software stack. For example, Workiz’s Pro plan (which explicitly includes “AI tools”) is listed at $325/month including the first 5 users. (Workiz pricing) Your actual ROI depends on implementation quality, not the existence of features.
Tooling Stack (Minimal, Not Fancy)
You can build this in two ways:
Option A: Field-service platform + light analytics
FSM/CRM: your existing system (ServiceTitan, Workiz, Housecall Pro, etc.).
Data export: weekly job/call exports (CSV) + membership count.
Forecast layer: a small Python notebook or a managed BI tool with a forecasting model.
Option B: Spreadsheet-first (for operators under $2M)
Weekly calls + revenue + average ticket
Daily mean temperature (or a proxy) → computed CDD
Simple regression forecast + manual overrides
Option B works as a stepping stone, but the moment you have two crews and multiple service areas, you want the platform export route so the model refreshes without human effort.
90-Day Rollout Plan (Phoenix Operator)
Days 1–14: Instrumentation + definitions
Define the target: weekly booked calls or weekly booked revenue.
Export 18–36 months of historical jobs/calls if available.
Stand up daily weather ingestion; compute CDD; cross-check occasionally against NWS Phoenix daily climate report. (NWS Phoenix CDD table)
Days 15–45: Build the baseline model
Fit a simple model: demand = f(CDD, day-of-week, marketing spend, membership base).
Validate: does it correctly predict the direction of week-to-week swings?
Choose one decision to drive (staffing or dispatch).
Days 46–90: Add ops telemetry + margin protection
Add first-time-fix, callbacks, and parts wait time as explanatory features.
Create a weekly “peak readiness” checklist (coverage, inventory, routing rules).
Lock in marketing pacing rules so you do not buy demand you cannot serve.
Local Constraint Check: 2026 APS Rebate Changes
If you rely on utility programs to help close replacement jobs, note that APS indicates its Solutions for Business New Construction program and HVAC rebates under the Solutions for Business Existing Facilities program were discontinued as of January 1, 2026 (under review following Arizona Corporation Commission Decision No. 81584). (APS notice)
In a world with fewer rebates, tightening margin by forecasting and execution becomes even more important: you win by showing up faster, diagnosing correctly, and capturing more jobs you can actually service.
More from the Phoenix HVAC AI Series
Why Phoenix HVAC Efficiency Standards Are Disrupting Solar Integration Valuation Models
Analyzing Proprietary Logistics Algorithms Used by Top Arizona Climate Control Startups
How Generative AI Fixed Customer Acquisition Costs for Phoenix Residential Service Companies
Assessing Machine Learning Maintenance Schedules in the 2026 Arizona Smart Home Market
Comparing Phoenix HVAC Profit Margins Against New Federal AI Energy Compliance Mandates